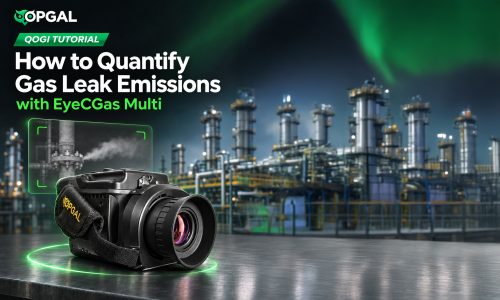

Finding emissions is no longer enough. Operators now have to show how much gas is escaping, in grams per hour, with evidence. The EyeCGas® Multi measures this in the camera, and our new video manual shows how to do it right.
Detection vs. quantification: what the rules require
The regulations ask for two different things. Detection means finding leaks and fixing them. The EU Methane Regulation 2024/1787 sets LDAR detection thresholds: Type 1 surveys at 7,000 ppm or 17 g/h, Type 2 at 500 ppm or 1 g/h. A repair must be attempted within 5 days and completed within 30. Opgal cites a validated sensitivity of 0.35 g/h, below the EU’s strictest 1 g/h threshold. In the US, EPA’s NSPS OOOOb/c and Appendix K make OGI the standard survey method; EPA proposed revisions on 29 October 2026, but the 2024 rules apply until a final rule. Quantification means reporting how much is emitted, from measurements rather than generic factors. The EU requires verified source-level quantification reports from February 2026, later reconciled with site-level measurements. OGMP 2.0 Level 4 calls for measurement-based, source-level data, and Level 5 for reconciliation with site-level measurements, within 3 years for operated assets. EPA’s Subpart W moved toward measured data in 2024, though a pending proposal would suspend most reporting until 2034. EU importers must also show that their suppliers meet equivalent standards, so producers worldwide are being asked for measured data.
How Opgal’s EyeCGas Multi quantifies a leak
The camera does both jobs: it finds the leak, then measures it, with no separate tablet or post-processing. You enter five inputs: lens, distance, gas type, wind speed and Camera Quantification mode. It returns three live readings: concentration C (ppm, every second), leak rate LR (g/h, every 5 seconds) and C MAX (peak ppm over 10 seconds).
Proven accuracy: the GERG benchmark
In the European Gas Research Group’s Phase IIA Technology Benchmark, ten technologies measured 17 blind methane releases at a compressor station. As reported by Opgal, EyeCGas 2.0 and EyeCSite QOGI gave the results closest to the actual releases of the three OGI technologies tested.
The procedure in six steps
- Locate the leak in Normal or Thermography mode, then mount the camera on a stable tripod. Set units to Celsius and emissivity to 0.95 or more.
- Enter the inputs. In Imaging Modes, select Quantification and enter lens, distance, gas type and wind speed. Measure distance and wind; never guess them.
- Steps 1–2: Start. Select Camera Quantification as the measurement mode, then press MENU to return to the live image.
- Step 3: Check ΔT. Long-press the DOWN arrow and briefly cover the lens with paper: ΔT should read 0. Then aim for a ΔT of ±5 to ±10 °C against the background.
- Step 4: Place the black square. Keep the source inside the side box and put the square downwind, with the plume crossing it.
- Step 5: Read and record. Watch C, LR and C MAX, then press RECORD for 60–120 seconds, until the counter reaches 8 or more. The camera saves a video with on-screen values and a CSV with the inputs and mean results.
- Step 6: Exit by returning to Viewing Mode.
Use the CSV’s mean emission rate, not a single on-screen value, for average emission rate of the quantification video.
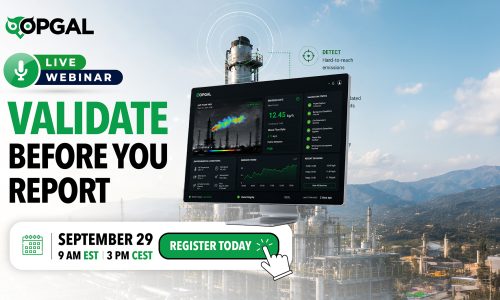
Validate before you report: EyeQGas
EyeQGas is Opgal’s AI-driven, cloud-based QOGI validation and plume colorization software. Before any number goes into a report, it checks that the measurement holds up.
- Upload OGI recordings and their data to the platform.
- Automatic checks confirm plume capture, environmental conditions, wind data and emission rates.
- Get back colorized, quantified videos and validated reports fit for regulatory reporting.
- Share evidence that technicians, managers and regulators can review, with account management for LDAR teams.
From the camera to your compliance file
Each source measurement leaves videos, CSV files and, through EyeQGas, a validated report for any emission source. These records show a leak’s rate at detection and after repair for the EU regulation. They supply measured, source-level data for OGMP 2.0 Levels 4 and 5, and they help crews fix the largest leaks first.
Watch the video manual
Want to see quantification on your site? Contact the Opgal team for a demo or training.